Sunday, March 23, 12025 Human Era (HE)
Communication Tools: Back to Zones
Attempts to quantify intensity bring us back to the concept of zones. Using zones is a slightly more objective (compared to subjective ratings of efforts) and quantifiable tool to communicate and monitor training intensity. Ultimately, quantifying intensity is an attempt to measure energy metabolism or expenditure. Conventionally, this has been predicated on heart rate and stratified into different “zones” in order to classify the predominant metabolic pathways. Heart rate, however, is an imperfect surrogate for metabolism or energy expenditure, which is the holy grail of what we are trying to assess.
Do Domains Differ from Zones: Distinction or Dogmatic Disagreement
A brief rant here if I may…
Recently, I have come across the term exercise intensity domains more often in the context of classifying exercise intensity categories. The domain term left me wondering what the difference was compared to the zone terminology I was more familiar with.
One difference is that the domain framework of exercise intensity typically has four distinctions, moderate, heavy, severe, and extreme. In comparison, the zone model traditionally had three zones (1, 2, and 3). However, over its history, the zone model has developed additional off-shoots, blossoming into five, six, and even seven zone branches.
Another difference is the origin of the models. One reason for the development of the domain model was to clean up the exercise science literature regarding intensity by establishing specific criteria related to the underlying physiological energy systems in an attempt to provide more standardization (though the domain model also has its own off-shoots). The proponents of the domain model will tell you that its advantage is that the domains are discretely defined and reflect the underlying physiology. At a superficial level, that is true. The exercise domains framework is based on better objective measures of physiological phenomenon that are related to the distinct classifications.
However, as is the case with the zone model, the framework is still an attempt to discretely determine what is, in reality, a continuum. One difference is that the domain system comes with a little less baggage since it was more recently developed and perhaps more directly for academia. The domain model has been influenced less by the practical training grounds that forged the zone model. Years of use in the hot ovens of the training world have moulded and melded the model to new and individualized forms. Over the years, the lack or misunderstanding of specific definitions has led to a wild west of philosophies and practice. A simple example is the confusion that surrounds the identification of the now popular Zone 2 training, which refers to the six zone model of Iñigo San Millán, not the second zone of the original three zone model.
Ironically, despite the argument that the domain model is based on objective physiological criteria, I think the zone models attempt to do the same. Arguably, the zone models arose out of historic findings in physiology that created constructs of thresholds like the aerobic, ventilatory, anaerobic, and lactate threshold. Where things get messy and unclear is what exactly these findings represent, if anything, and how do we go about measuring them (what protocol do you use as for each there are multiple). The same can be generally said of the domain method, with the distinction that the criteria are slightly clearer. Ultimately, the thresholds, or cut-offs, are based on the same concepts. Though the domain model has the advantage of the academic arena, in that its use and quantification are often laboratory based. It is easier to determine these values with tools like blood lactate, power, and gas exchange.
A sweeping simple comparison of the criteria for the three zone versus domain models demonstrats their similarities. Zone 1 or low intensity, that is the moderate domain, is below the first ventilatory (VT1) and/or lactate threshold (LT1). Zone 2 or moderate intensity, the heavy domain, is between VT1/LT1 and the second ventilatory (VT2) and/or lactate threshold (LT2). Zone 3 or high intensity, the severe domain, is above VT2/LT2. This is overly simplified as VTs and LTs are not equal, and the summary omits the upper limit of the domain system, the extreme range. Though it is arguably overlooked in the classic three zone model as either a subcategory of zone 3 or absent altogether. The point is that both systems are based on the same constructs with the domain model distinguished by more concrete definitions of those constructs.
Okay, back to intensity as a communication/training tool…
Gold Standard vs. Sub Standard Metabolic Measurements: Calorimetry
As alluded to, the practical application of training zones is an attempt to quantify energy expenditure during exercise. The science of measuring energy expenditure is broadly known as calorimetry. Calorimetry “is the science of determining the change in energy of a system by measuring the heat exchange of the system with the surroundings.” Most of us are familiar with the term “Calories” or kilocalories (kcal) from food labels and aware that they are a unit of energy.
Calories Versus calories
What sometimes is less familiar is that calories are ultimately a measure of heat. The term “calorie” comes from Latin calor meaning ‘heat’. Confusingly, there are both small and large calories [often distinguished by a lower case (calorie) or upper case (Calorie) spelling, but not always], with the former being one one-thousandth of the latter. Thus a calorie is either defined as “a unit of energy equivalent to the heat energy needed to raise the temperature of 1 gram of water by 1 °C (now often defined as equal to 4.1868 joules)” or “a unit of energy, often used to express the nutritional value of foods, equivalent to the heat energy needed to raise the temperature of 1 kilogram of water by 1 °C, and equal to one thousand small calories; a kilocalorie.” The “Calories” listed on food labels are the large, big C calories, as in kcals.
Direct Versus Indirect
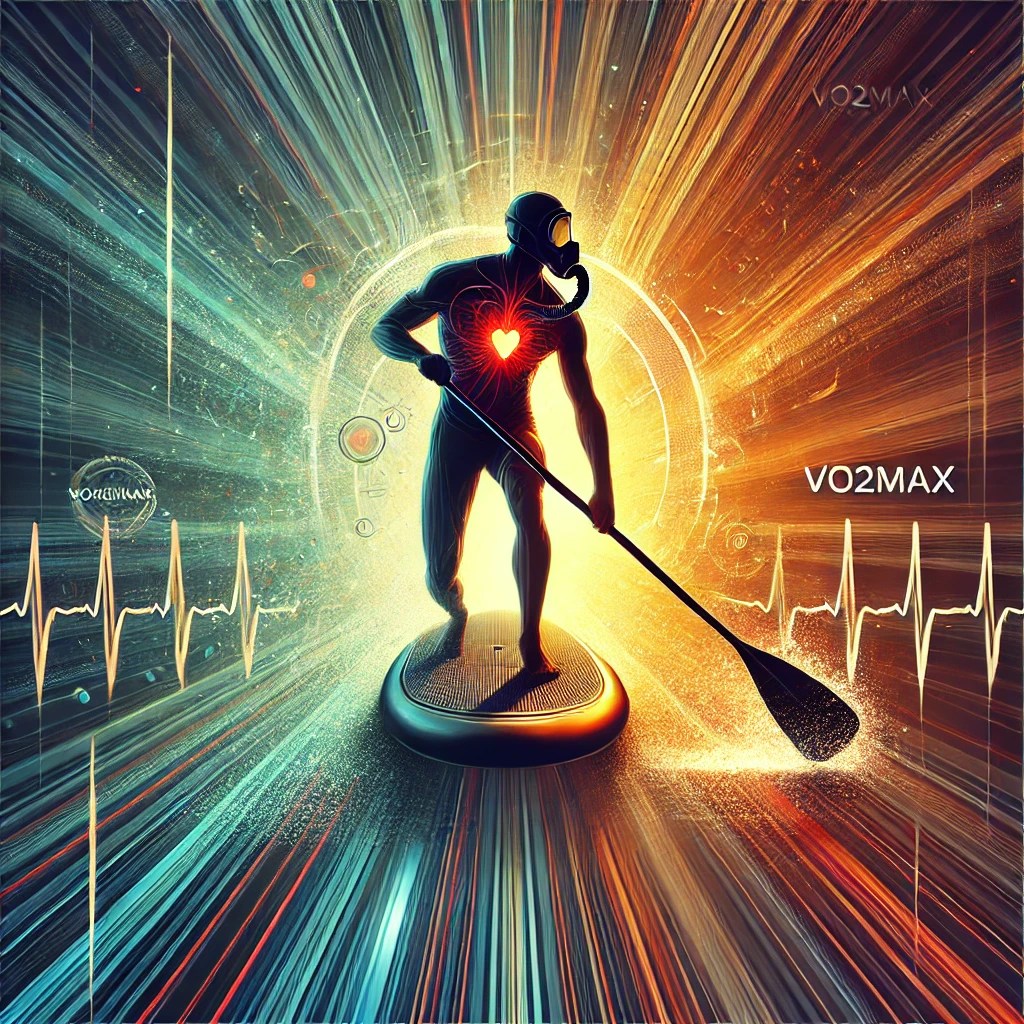
In the science of calorimetry for the purpose of human bioenergetics, the system from the above definition, is the human body. Crudely stated then, calorimetry is an attempt to measure the combustion reactions of the human body in which food stuffs, or carbon-based compounds, are burned to give way to useable energy to perform work in the form of bodily processes or movement/exercise and heat. One way to measure that exchange is to put a human in a sealed chamber and measure the heat directly, i.e., direct calorimetry. This has the disadvantage of being costly and impractical, since it requires sensitive equipment and a thermally sealed chamber. The other option, indirect calorimetry, uses measures of total body respiratory gas exchange, that is oxygen (O2) consumption and carbon dioxide (CO2) production, to indirectly determine the heat exchange and calculate energy expenditure. This is much more practical than a dedicated chamber, though until recently, it was reserved to academic sports science settings where sophisticated apparatus was available. Indirect calorimetry is best known as the now notorious VO2max test.
The gallery below depicts some the change in technology used to measure indirect calorimetry beginning with the Douglas Bag method for gas collection, progressing to metabolic carts with hoses connected to a smaller scale analyzer, before the transition to face mask analyzers without collection hoses, and finally the most modern portable wireless analyzers.


Gold Versus Silver
The scientific gold standard for measuring total energy expenditure utilizes a technique called doubly labelled water. Essentially, stable isotopes of hydrogen [deuterium (2H)] and oxygen [oxygen-18 (18O)] are orally administered via water and the elimination of the isotopes from the body is tracked. The difference in the elimination rates between the two isotopes allows for the rate of CO2 production to be calculated, which is directly proportional to energy expenditure (see image below). However, this is costly, technically complex, and unsuitable for short-term measurements. Enter the silver standard.

A Shiny Second: VO2
The clinical gold (cough – silver) standard measurement of human metabolism/bioenergetics is indirect calorimetry. That is measuring the volume of O2 consumed (VO2) and CO2 produced (VCO2) in order to estimate energy expenditure. A quick side note is that VO2max is the maximum rate of oxygen consumption attainable during physical exertion, whereas VO2, without the “max,” is just the volume of oxygen consumed, often expressed as a rate in absolute (litres per minute) or relative (millilitres per kilogram of body weight per minute) terms.
The information obtained from calorimetry, whether direct or indirect, via volumes of O2 and CO2, is more of a summary, as oxygen consumption and CO2 production are more reflective of the final metabolic pathway for all energy conversion in the body and does not necessarily give insight into energy flux through specific metabolic pathways (e.g., the phosphagen and glycolytic systems directly). It may be that the emerging field of metabolomics will give future insight, but for the time being, our gold standard of oxygen oxidation only gives the overview. For a more thorough explanation of metabolomics, see here.
Regardless, eventually, the phosphagen and glycolytic pathways cycle through oxidative processes, so if you measure gas exchange for long enough, you will ultimately see this metabolism reflected, albeit under a time delay. Colloquially, this is referred to as the “afterburn” of exercise, or more formally, excess post-exercise oxygen consumption (or EPOC for short). Excess post-exercise oxygen consumption is the additional oxygen the body consumes after elevated exertion that is needed to restore the body to a resting state or homeostasis. The established linear relationship between VO2 and energy expenditure, and the ease, at least in a laboratory setting, of measurement is why VO2 is the clinical gold standard of metabolic measurement. However, measuring VO2 still remains impractical, mostly due to cost, despite the development of portable measurement units. But the future is blossoming.
Fun Fact on Engine Energy Efficiency
It is worth noting that calorimetry is measuring gross heat outputs for the human body. However, in athletics, the variable of interest is external work performed, not how hot you get. Athletes care about how they move their bodies or objects with their bodies. Total energy expenditure as measured by calorimetry is the sum of both heat production (waste energy lost as heat) and work performed (external mechanical energy output). While the former has an effect on performance, it is the latter that we witness as relevant to athletics. However, the body is not 100% efficient at converting chemical/food energy into mechanical work and a significant portion of energy is lost as heat, which is great for warm blooded animals since our optimal temperature range is somewhere between approximately 35.5 to 37.9°C (or more commonly assumed to be 36.5–37.5°C) and the Earth’s global average temperature is only about 14.5°C. But this extra heat production is not so great for bioenergetic efficiency.
It is estimated that the efficiency of human movement is around 20–25%. This means 75–80% of the total energy expenditure is lost as heat. Keep that in mind the next time you hear about a herculean athlete’s hour of power output that is greater than 400 Watts. The external power output is 400 Watts, but that means their total power output would be upwards of 1600 Watts!
The Evolution of the Practice
All attempts to quantify metabolism or bodily bioenergetics have limitations and trade-offs. Often, the greatest trade-offs are accuracy versus the ease of measurement. Historically laboratory based measures like VO2, blood lactate, heart rate, and power, while perhaps more accurate, were inaccessible, along with minor imperfections. Presently, we are in an era where general affluence and technological development is democratizing the once ivory tower confined tools of sport sciences. However, it was from these initially laboratory-based measurements that the linear relationship between heart rate and VO2 was established that has allowed the former to be used to extrapolate energy expenditure and quantify exercise intensity.
Many notable moments occurred along this journey of energy/intensity discovery. To name a few, in the mid-11950s HE, Martti Karvonen developed the concept of the heart rate reserve method to scale exercise intensity as a way to look not just at the absolute rise in heart rate, but the useful beats above baseline or resting heart rate. The psychologist Gunnar Borg created a rating of perceived exertion (RPE), which came to be known as the Borg scale (c. 11960s HE), as an attempt to relate a subjective sense of intensity scale to the more objective measure of heart rate. The original scale, which was from 6 to 20, worked by adding a zero to the effort number, which tended to then relate to a heart rate. For example, someone working out at 13 out of 20, verbally described as ‘somewhat hard,’ would tend to be around 130 beats per minute.
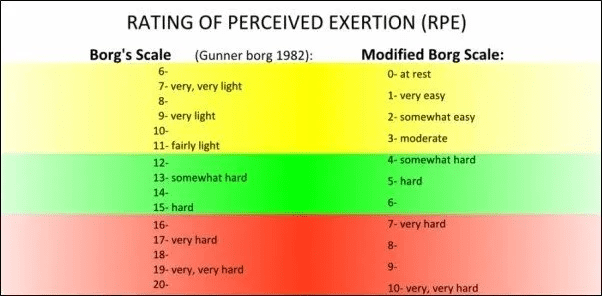
The infamous Fox formula was created in the 11970s (HE), anchoring exercise enthusiasts to a predicated maximum heart that was 220 beats minus our age (more on this to come in a later post). In the late 11970s and early 80s, the portable heart rate monitor began to gain popularity, making previously laboratory based measurements accessible to the masses. The development of the OMNI-RPE scale 11990s attempted to make the more confusing original 6 to 20 point Borg scale more intuitive on a 10-point scale. Around the same time, another subjective measure, the talk test, was popularized as a way to skip over heart rate measures and anchor workload to VO2 again, albeit this time via breathing rate. The premise being, if you can maintain a conversation you are working at at sustainable oxidative (aerobic) effort.
Now we’ve outsourced the problem of determining intensity to fitness watches and trackers equipped with optical heart rate sensors, GPS, accelerometry, power, and more, making the historically lab-based measurements mainstream.
Stayed tuned for the next installation to find out what metrics are mainstream…
