Theory
Saturday, June 25, 12022 HE
Those who know me know that I am a nerd. I like to know things and have a propensity to investigate (too) deeply into a topic. So, here is my take on the inflow/outflow wind phenomenon in Átl’ḵa7tsem (Howe Sound). This post is a nerdy venture into the science of the squamish winds of the Sound. A theoretical account of downwinding in the Sound, which I hope to complement with more practical accounts in the future. Here is a road map for the post.
- Theory
- What is Wind?
- British Columbia’s Geography
- How Crazy is Dihydrogen Monoxide?
- Seasonal Flow
- Prediction Tips and Tricks
What is Wind?
The back story to this post stems from me stumbling across the phenomenon of downwinding by accident in the Sound. In the summer of 12020 HE, I did my first serious solo trip in Átl’ḵa7tsem (Howe Sound). I attempted a round-trip paddle from Porteau Cove to Britannia Beach. In the 20/20 clarity of hindsight, I was ill-prepared. Despite warnings from my father-in-law, a seasoned sailor, regarding the winds in the fjord, I went ahead with my voyage nonetheless. I wasn’t completely cavalier about his warning. Far from it, I gave it due heed, but hindsight reveals I didn’t understand the complexity of fjordal weather at the time. Pre-paddle I consulted some resources online about the safe and tolerable wind levels for stand up paddleboarding (SUP). I had checked the forecast for the weather conditions, surveyed the real-time conditions from the shoreline (the weather forecast isn’t always correct), and had a float plan among other safety precautions. But where I failed and was mostly lucky on reflection was my lack of understanding of diabatic winds in the fjord. I say “lucky” because my pre-paddle shoreline survey confirmed the outflow winds, leaving me comfortable paddling into the wind since I assumed I would have a tailwind for the return leg (and you know what they say about “assume“). I was completely unaware of the potential shift in the wind that could have occurred if the solar radiation shifted the thermal gradient between marine and landmass air temperature and pressure (e.g., see an example in this post) reversed.
The wind is “the perceptible natural movement of the air, especially in the form of a current of air blowing from a particular direction.” Wind results from the differential heating of the Earth due to insolation, which creates temperature differences in the environment. Insolation, a lovely portmanteau, is the incidence of solar radiation onto an object. Some of the electromagnetic radiation (i.e., light) emitted by the Sun eventually reaches the Earth’s surface after travelling through the vacuum of space and penetrating Earth’s atmosphere.
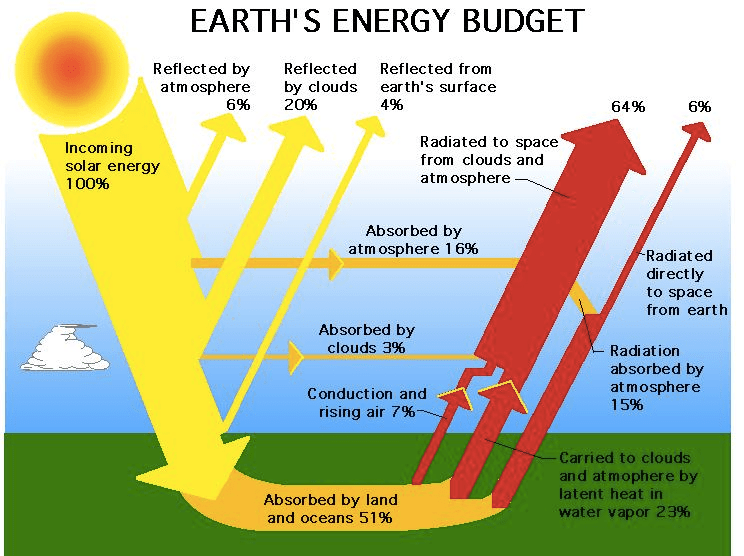
The heated surface of the Earth then re-emits the energy of the Sun as long-wave infrared radiation (for an in-depth explanation, see this video from But Why? on “Why Do Hot Objects Glow? – Black Body Radiation“). Compounds in the atmosphere, known as greenhouse gases, absorb the radiation, resulting in the heating of the atmosphere. This process is the greenhouse effect, whereby the Sun’s energy is trapped, as heat, in the atmosphere (But Why? has a video on the greenhouse effect too). A familiar example of the greenhouse effect is a car heating up on a hot day. Short-wavelength electromagnetic radiation enters the vehicle but cannot exit after conversion to a longer wavelength. The energy from the light (i.e., photons) excites the material of the interior. In doing so, the light loses some of its energy, increasing its wavelength. The lost energy of the light is in fact transferred to the car interior, increasing its molecular vibratory state!
Temperature, that is, how hot or cold something is, is a measure of the average kinetic energy of the atoms or molecules in an object or system. An object with a higher temperature has more kinetic energy at the molecular level. With air, as its temperature, or kinetic energy, increases, the molecules move more rapidly and spread out, making the air less dense. Warm air thus rises, creating an area of low pressure. Air, as a fluid, moves according to the pressure-gradient force from high pressure to low pressure. Wind will travel along a pressure gradient from high pressure to low pressure. However, the wind is also influenced by the Coriolis effect and topography (or friction). For an in-depth account of the explanation of Earth’s atmosphere see this online resource from the Center for Coastal Physical Oceanography.
I sometimes found the relationship between temperature, pressure, and density confusing. A big part of that stemmed from attempting to understand the three-cell model of global circulation. Particularly, the subtropical high-pressure belt, where warmer air is theorized to descend. The resolution of my confusion came from summarizing areas of rising air as low pressure and descending air as high pressure. Before that revelation, I was associating rising air with rising temperature and couldn’t make sense of the pressure effect (in my mind the increased temperature should have coincided with increased pressure).

Thus the overall summary is that warm air will rise. Rising air creates an area of low pressure. Higher pressure air from the surroundings will blow towards the area of low pressure (pressure gradient from high to low), and that gives you your wind.
Check out the short video below for a visual explanation and more clarity. While we cannot directly see the movement of air molecules, we can feel and observe their effects on objects in the environment.
The naming of wind direction stems from weather vanes (a.k.a., a wind vane, or my favorite term, a weathercock). You’ve likely seen a weathercock before (see below), but perhaps like me, you didn’t know it by name when you did.

The vane in weather vane comes from the Old English word fana, meaning “flag”. Weather vanes are the reason why winds are named from where they come versus where they are going (this confused me when initially learning about the wind and weather as to me, it made more sense to talk about the wind in the context of where it was blowing not coming). When a weathercock is blown, it will point in the direction of the wind, hence the naming convention. Wind direction is always named for where it is blowing FROM, not towards. For example, a wind blowing from the west is a westerly wind.
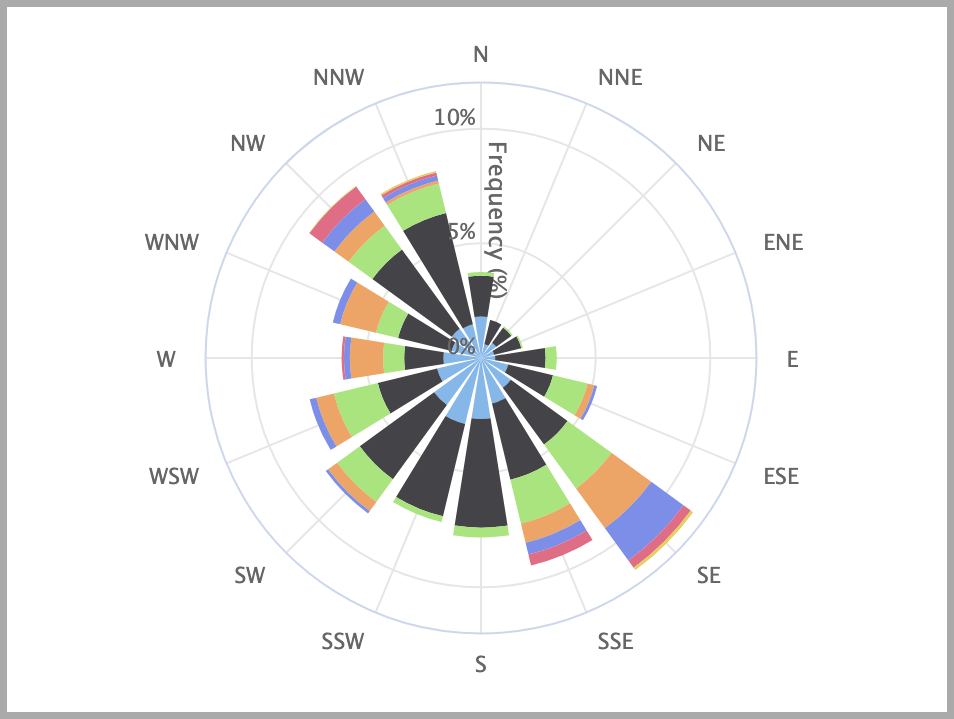
Our current convention of naming wind direction stems from the concept of cardinal directions. The cardinal directions have their origins in the classical compass winds of antiquity. It is from these early abstractions that the idea of the wind rose arises, as the modern meteorological morphing of a compass rose. The modern wind rose is a vector diagram or graphical chart, that illustrates wind speed and direction (see image below).
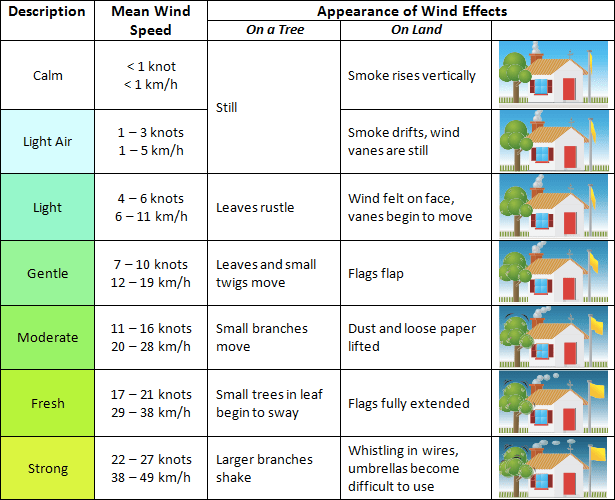
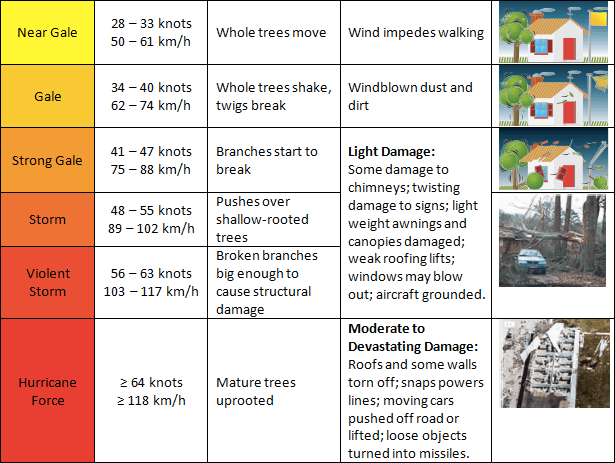
Wind speed, is measured with an anemometer. The wind speed can also be estimated by using verbal descriptions related to the wind’s effect on everyday items through the Beaufort wind scale. The table below from New Zealand‘s METserviceblog site post on “What is a fresh wind?” is the Beaufort scale with pictographic icons of the land effects. I think the images are helpful to have a calibration anchor point for wind speeds. Before getting into SUP, I paid little attention to the wind, but now I feel that I can estimate the wind relatively accurately when out on the water with a mental reference point. The pictographs are a simple reference with near-ubiquitous familiarity.
In summary, the wind is the observable effect of temperature and pressure on air molecules and is a vector phenomenon, having both speed and direction.
British Columbia’s Geography
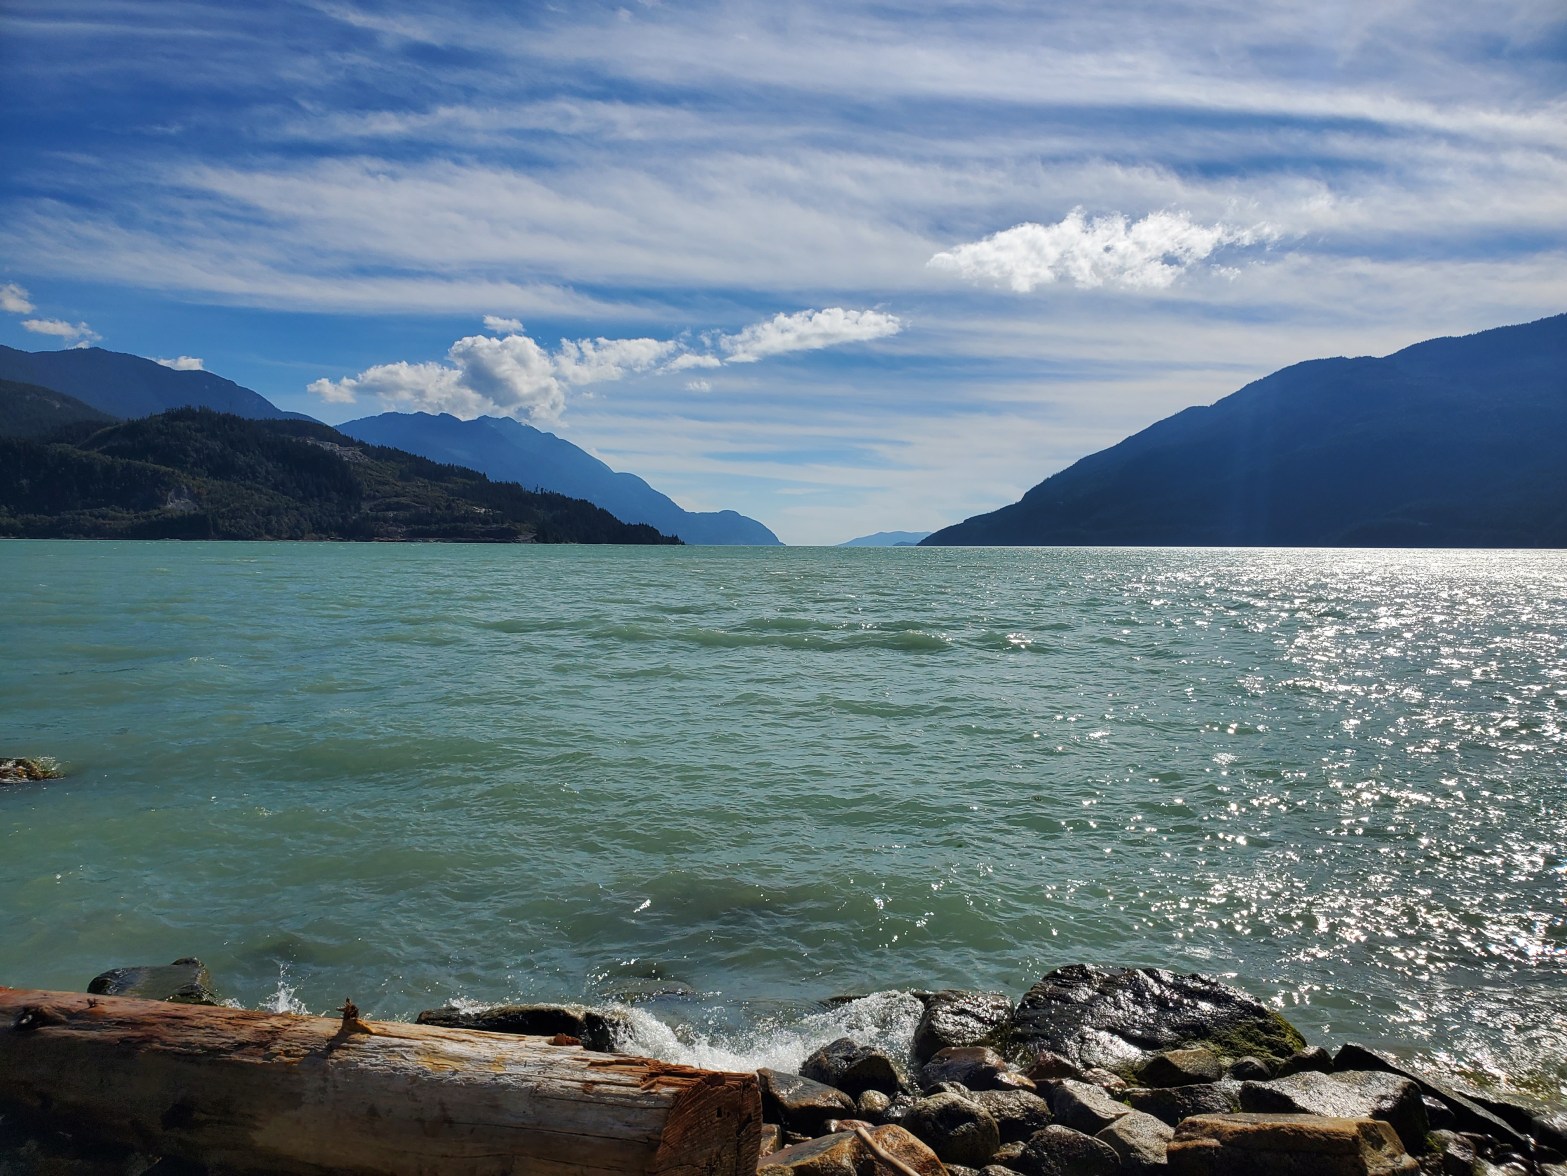
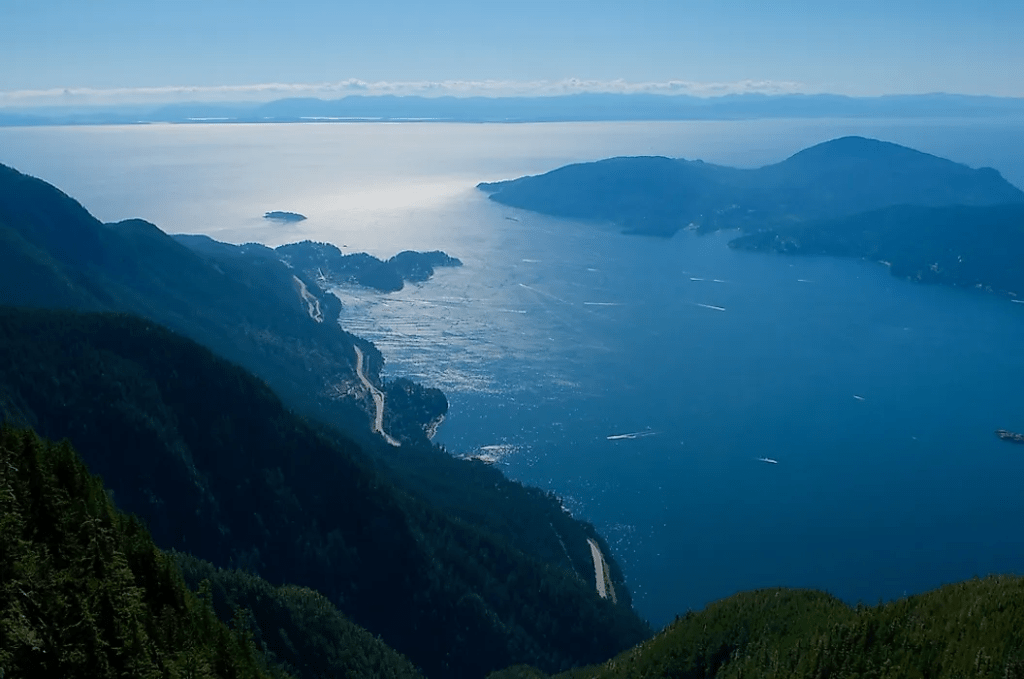
Átl’ḵa7tsem (Howe Sound) is a triangular-shaped sound located on the southwestern coastline of British Columbia (BC).

The formation of BC is fascinating. The story starts over 200 million years ago with the breaking up of the supercontinent Pangea. Essentially the Pacific and North American tectonic plates collided, welding the terranes, Stikinia and Quesnellia, to the continental plate. This first collision formed the Omineca Belt and was followed by subsequent collisions when the Wrangellia and Alexander terranes combined to form the rest of what we now call BC. For a brief overview of this process, check out the video below from the Kumtuks YouTube channel titled “British Columbia Geology“. I recently came across the Kumtuks content when searching for information on BC’s weather patterns. For a more in-depth account of the geological processes that created BC, check out this 11993 HE documentary from the Geological Survey of Canada called “Where Terranes Collide: The Geology of Western Canada“. If you prefer a written account, you can check out this article from Earth Magazine titled “Travels in Geology: From sea to sky in British Columbia“.
Átl’ḵa7tsem (Howe Sound) contains a network of fjords. The fjords were cut-out by glaciation during the last ice age. Approximately 20,000 years ago, the Sound was entombed by an ice sheath over two kilometres high. As the climate warmed and the ice melted, the rising seawater levels filled the fjords that the ice had previously formed. This process happened all along the BC coastline resulting in numerous fjords. With their steep edges, fjords act as funnels, moving air inland (inflow) or coastally (outflow).
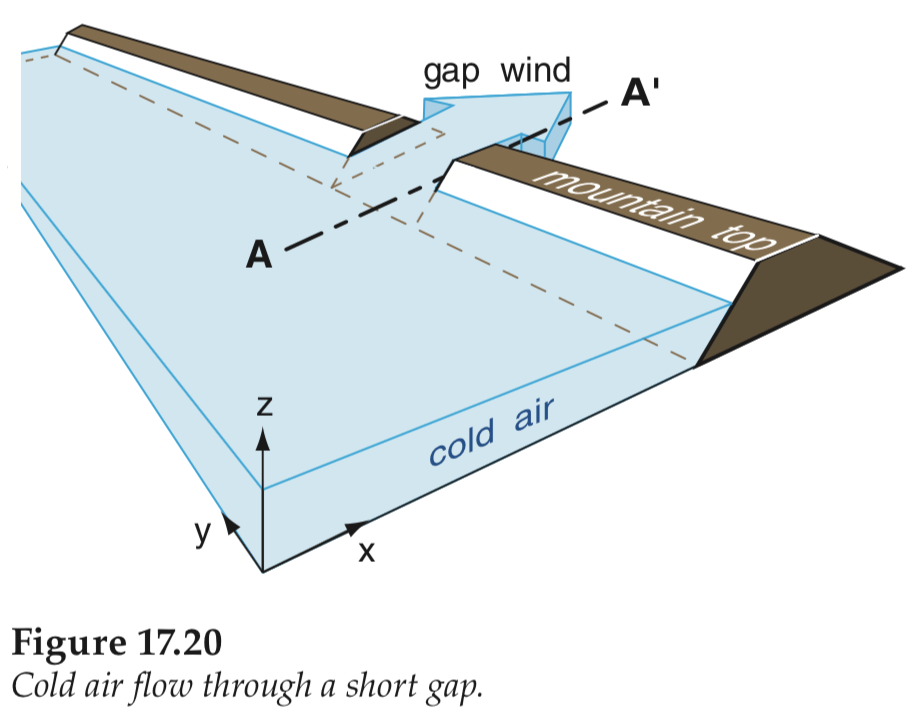
Another aspect of the west coast maritimal geography affecting the fjordal wind patterns is the Coast Mountains. The mountains form a physical barrier limiting the movement of air between the continent and coast. However, gaps within the mountain range do allow air to move between the interior plateau and coastal waters (see the image below). This factor is more significant in the winter outflow winds.

How Crazy is Dihydrogen Monoxide?
Water has a higher specific heat capacity than land (over a four-fold difference). The higher specific heat capacity means water takes longer to heat up or cool down than land. A magnificently wonderful property of water is that it is a polar molecule, which allows for hydrogen bonds and life as we know it! Check out this amazing video, “Why Water is So Special and Essential to Life,” from But Why? Water’s specific heat properties mean that insolation overland and water will heat the land faster, ultimately warming the overland air more. The differential heating creates thermal gradients between continental and maritime air masses. The thermal gradient is the basis for wind formation for the fjord system as it will ultimately create a pressure gradient.
Seasonal Flow
The tilt of the Earth’s axis gives us our seasons. In the Northern Hemisphere, summer happens when the north pole is tilted toward the Sun, resulting in more insolation. The Sun’s rays strike the Earth’s surface at a more direct angle, ultimately resulting in higher land-surface temperatures in the summer months in the northern hemisphere, i.e., June to August (see the monthly temperature trends video below).
The seasons manifest their effects on the fjords of the west coast. In the summer, the Sun’s increased insolation drives thermal winds over a day/night cycle. During the day, air masses in the interior of BC warm faster than maritime air masses (remember the specific heat of water). Rising air inland thus pulls air from the coast, creating inflows in the fjords. At night the reverse happens. The inland air cools more rapidly (hello again, specific heat) than the maritime air and thus sinks, creating high-pressure zones and outflow winds. The outflowing wind is also coupled with katabatic winds. The katabatic winds occur at night, when air masses over the coastal mountains cool, becoming denser, and fall. The cool, falling air is channeled out toward the coast.
The inflow/outflow pattern in the summer is generally weaker than in the winter but more reliable. This pattern is dependent on the amount of insolation and can be predicted by cloud cover, or perhaps better, lack thereof.
During the winter months (i.e., December to February) there is a trend toward outflow winds in the Sound. The Coast Mountains create a physical barrier that runs parallel to the coast that “can separate air of continental characteristics inland from air of maritime characteristics over the Pacific Ocean” (Bakri et al. 12). When cold arctic air moves into the BC interior, it creates a strong pressure gradient with the warmer air of the coast. The air masses over the Pacific coastal waters are moderated in their temperature by the specific heat capacity of the water below. Thus the high-pressure continental arctic air mass is drawn to the lower pressure maritime zone. The winds accelerate through the gaps in the mountain barrier (i.e., the valleys and fjords), which can create strong winter outflows. However, this process is less predictable than in the summer since the migration of arctic air masses to the interior is subject to more variability. The polar jet stream, as well as the polar vortex, play a role in controlling the arctic air masses.
As a small side note, there is a minor distinction between polar and arctic air masses. Often the two terms are used interchangeably and it is difficult to distinguish between the two air masses. In this post, I used the term “arctic” as that was what I found used on the UBC Department of Earth, Ocean and Atmospheric SciencesATSC 113 “Weather for Sailing, Flying & Snow Sports” website and in the Bakri et al. paper.
Prediction Tips and Tricks
So, knowing how the winds form in the Sound is one thing. But how do you know when they will form? In the summer, the winds will be an outflow when it is cooler and the sun is down (i.e., morning and evening) and inflow when it is hotter when the sun is out (i.e., afternoon). The graph below shows the synodic cycle of the winds through a warm summer’s day. The measurements are from the Squamish Windsports Society (SWS) website and recorded on June 25, 12021 HE, at the beginning of the heat dome that engulfed BC last summer. The weather station is located at the north end of the Sound near the mouth of the Squamish River, at the end of the Squamish Spit. Thus higher values are recorded during an inflow as the fetch is longer for southerly winds. Notice how the wind is strongest and southwesterly from the afternoon to early evening, which is the hottest period of the day.

You can get real-time wind data from the SWS here. Their site also has a link to a temperature grid from the Weather Talk For BC, which allows you to see and predict the temperature gradient from select cities from the interior to the coast.

The Bakri et al. paper reported that outflow wind speed has the strongest correlation with “the pressure gradients between Pam Rocks and Squamish and Pam Rocks and Pemberton” (12). The inflow wind speed is most strongly correlated with the pressure gradient “between Pam Rocks and Squamish” (12). However, the paper reported the pressure gradient values in hectopascals (hPa) and, to boot, with mean sea-level pressure standardization (i.e., hPa km-1). So… I don’t know what that fuck that means or how to relate that to the kilopascals that the Government of Canada posts for their weather forecasts (e.g., see here). My best guess is that it is a pressure standardized to altitude, but I have no idea how to convert that. Thankfully, the Bakri et al. paper also reported temperature estimates for inflow and outflow winds.
“The average along-channel decrease in air potential temperature (dewpoint temperature) of the outflows between Pemberton and Pam Rocks is 4.5°C (4°C) in the winter and 3°C (3°C) in the transition seasons. The cooler potential air temperature and dewpoint temperature associated with outflows at Pemberton confirms the cold and dry air source over the interior of BC associated with these northeasterly winds.”
Bakri et al. (18)
“The average along-channel potential temperature trend of the summer inflows is roughly the opposite of that for outflows: Pemberton, on average, is 6°C warmer than Pam Rocks.”
Bakri et al. (18)
I recall reading on a blog post that the summer inflows occur with a temperature difference as low as 3°C along the channel from Vancouver/Pam Rocks to Squamish. Whereas entry on the same post suggests looking for a 5°C difference between Lillooet and Vancouver. But as a word of warning, it isn’t always that simple. The thermal winds couple with the synoptic wind patterns and the effects can be additive or subtractive. While in the process of creating this post, I experienced an event with strong morning outflows that dampened the afternoon inflows. Though this experience happened in the mouth of the Sound and thus was more expected.
The take-home message is that the Sound can be a scary place with strong winds and rapidly changing conditions. But at the same time, it is an immensely beautiful geographic feature of the Lower Mainland coastline and with caution and understanding, can be experienced and enjoyed safely.
Citation
Bakri, Talaat, et al. “Along-Channel Winds in Howe Sound: Climatological Analysis and Case Studies.” Atmosphere-Ocean, vol. 55, no. 1, 2016, pp. 12–30., https://doi.org/10.1080/07055900.2016.1233094.

6 thoughts on “Down with the Sound”